A Framework for Participatory Decision Making
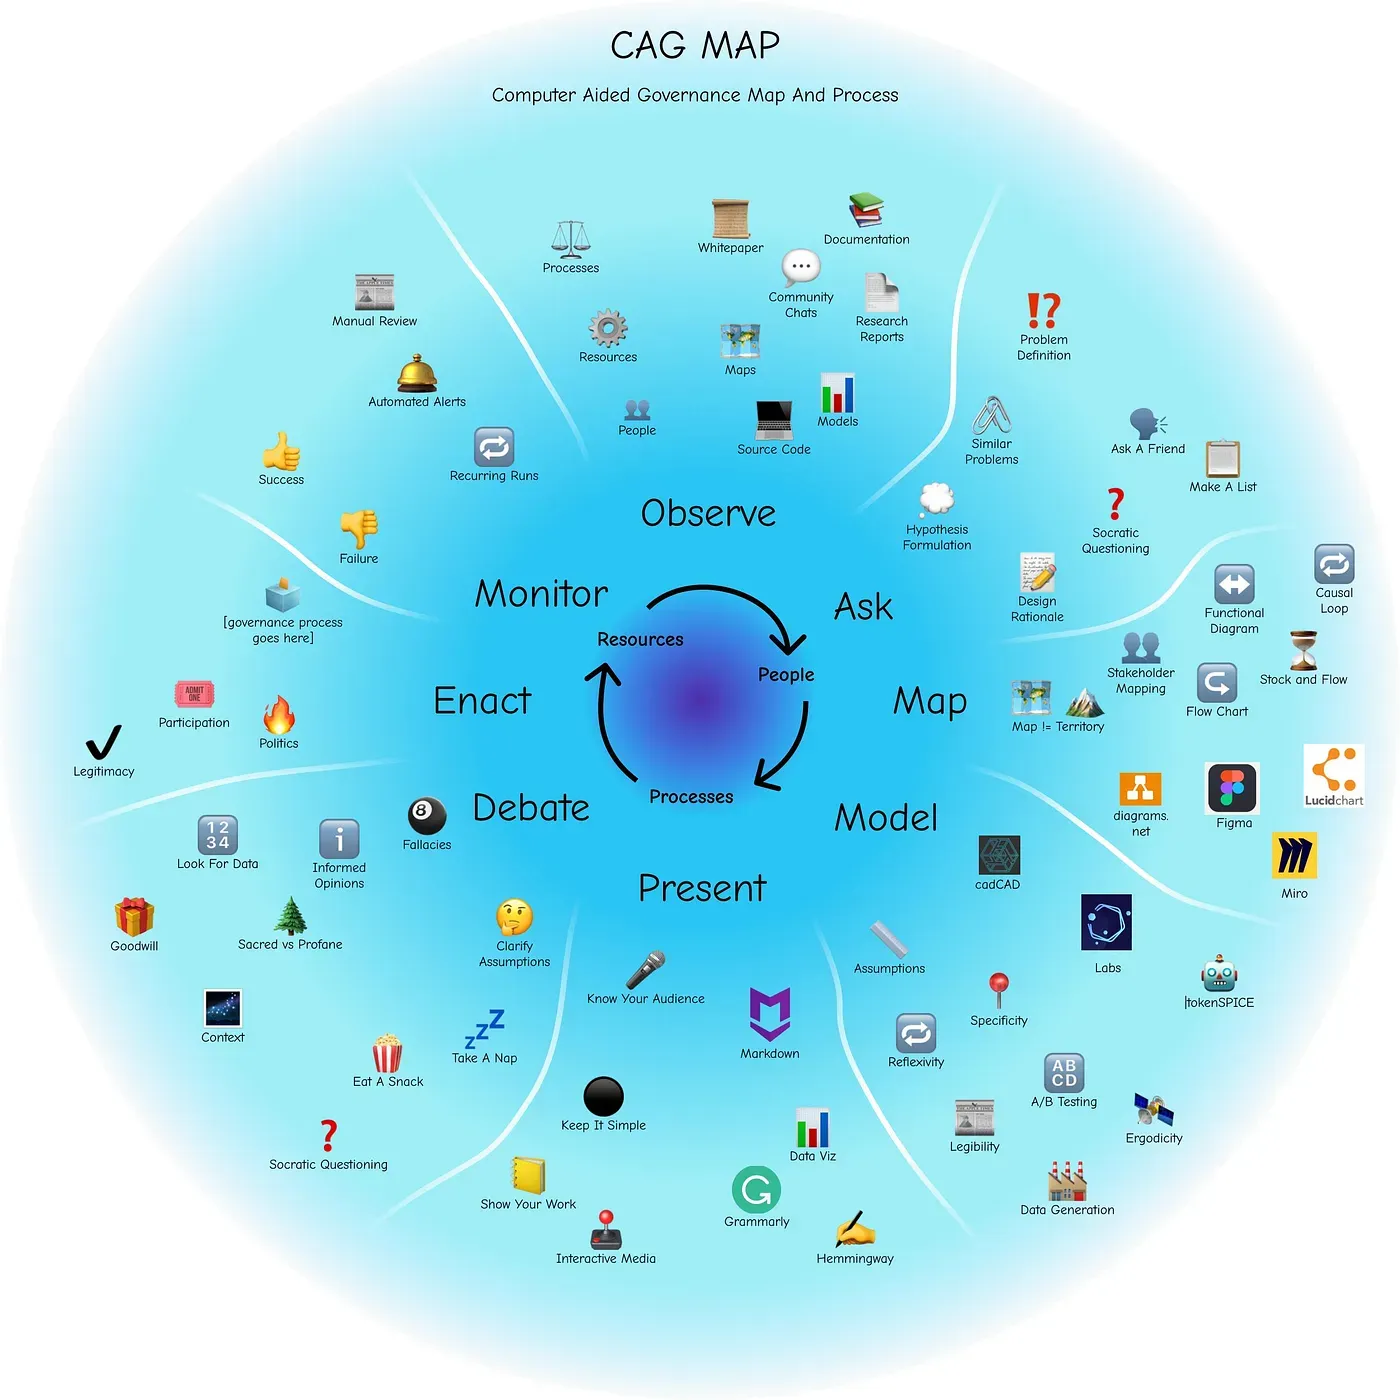
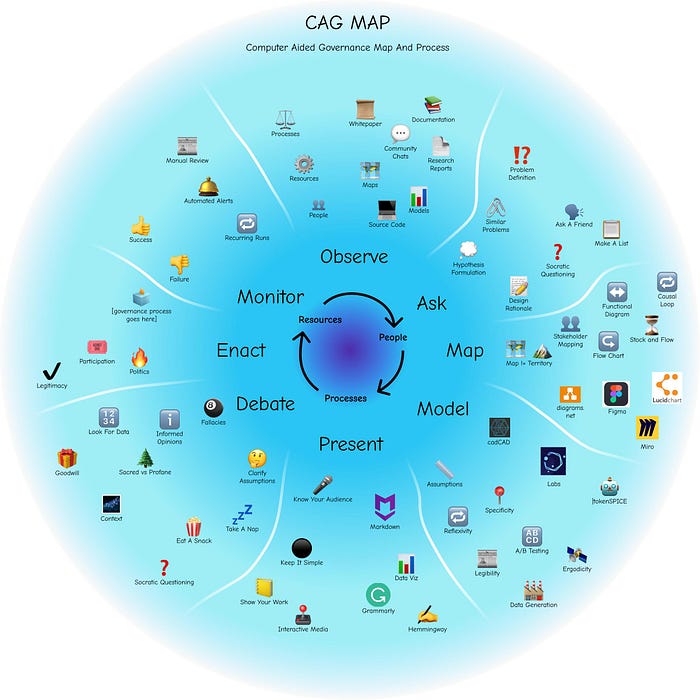
This overview is meant to provide intuition around a Computer-Aided Governance (CAG) Map and Process (MAP), at a very high level view. If you want to learn more, there is a living workbook that provides more detail. As computer-aided governance is an evolving field, the CAG MAP is also a continuous work in progress. Please feel free to check it out, open an Issue, submit a PR, or even fork it.
Motivation
The Computer-Aided Governance Map and Process (CAG MAP) explores how we can use computers to better understand and steer complex systems. Specifically, it explores tools and techniques for humans to draft and analyze governance proposals. This does not make assumptions about the dynamics or governance mechanisms of a system. It does, however, assume that those drafting and analyzing proposals are advocating for their interests.
This is important because a system with diverse stakeholders implies a diversity of viewpoints. This means there is no objective view of what is “best.” It’s all relative.
If that’s the case, then how are decisions made? The political process of compromise. This has a few requirements:
- First, stakeholders need to be able to participate in the political process. This might look like direct voting, delegation, or something else entirely — but stakeholders need to have a meaningful voice to affect change within the system (as opposed to just exit and loyalty).
- Second, there needs to be a ground truth to orient around. This is the data part of data driven decision making. We might interpret the data differently, but there needs to be a source of data that we can all agree on.
- Third, assumptions that are not objective reality, but are shared among stakeholders as an inter-subjective reality, need to be stated explicitly. This way stakeholders can agree on the strategy (mission/vision), even if they disagree on tactics (concrete steps to get there).
If these things are not present, then your first step is to figure them out. Without a basic foundation for governance, nothing else is going to work. If these things are present, however, then this CAG MAP might help stakeholders (like you) engage in data-driven decision making. Key word might. The CAG MAP is an ongoing research project so your mileage may vary.
It’s worth noting that aided is a key word in Computer-Aided Governance. The process describes the augmentation of human decision making processes via computers and data, rather than governance by computers or algorithms. This is similar to flight traffic controllers making critical decisions aided by the data-driven tools at their fingertips.
CAG Process
The Computer-Aided Governance map and process is divided into eight recursive parts:
1. Observe: the system in its natural state, its stocks & flows
2. Ask: who, what/what if, when, where, why?
3. Map: draw a picture representing interconnections
4. Model: thought experiments, with code!
5. Present: share your ideas with your community
6. Debate: collectively applied critical thinking
7. Enact: make a decision and take action
8. Monitor: log results for learning
Then Repeat: feedback leads to new questions, proposals, etc.
Remember, it’s a map, not the territory. The goal of this overview is to provide some intuition around the concepts & tools. It’s up to you to determine what’s useful for you and how to apply it within the context of the real world systems you’re engaging with.
Observe

In the context of socio-economic systems, the first step is to understand what is being governed by whom, and how. Even the choice to have “no governance” is a type of governance, it’s just informal governance. As you explore you’ll find a lot of information. Some will be true and some will be truthy. Knowing the difference is key. Some common resources that can help you figure this out are a white paper, documentation, source code, maps/models, research reports, system data, and community chats. Each of these sources has a perspective on the system, but only by combining multiple perspectives can you start to understand what’s really going on. When in doubt go to the source of the data and build up your thinking from first principles.
After doing some research you’ll start to understand how things work at a technical level, how people think they could/should/would work at an emotional level, and how people’s actions (based on their perceptions and preferences) shape the system’s fundamentals in a reflexive loop. If incentives are aligned, there’s a common ground of knowledge, and power structures are transparent — then perhaps your community could benefit from using Computer-Aided Governance to help make inclusive & informed decisions. If a participatory community is missing any of the above, be warned: there be dragons.
Ask

As you start to observe & explore a system it’s likely that you’ll have some questions. Some of these unanswered questions might highlight parts of the system that could improve. If so, then the next step is to figure out what the problem is and how to solve it. It’s important to spend a lot of time on this because solving problems starts with asking questions. You can’t solve something you don’t understand.
The most important thing is to have a clear and concise definition of the problem you’re trying to solve. It should be obvious. If you’re unclear about what you’re doing, everything else is more difficult. Once you have a clear problem definition you can explore similar problems. This might provide intuition around how other problems were solved and the results of implementing various solutions. This can then help you form a hypothesis of what is likely to help solve your problem.
There are several tools and techniques that can help you define your problem and identify likely solutions. The first is to just write it down. Try to define the problem in a single sentence and make a list of things of similar problems and their solutions. Then ask a friend and see what they have to say. Apply Socratic questioning to further explore the problem and your thinking around it. Then once you have a few good ideas produce a design rationale explaining your thought process, the ideas considered, and why you think a particular solution might work well. Then you’ll have a clear problem definition and solution hypothesis to test out.
Map
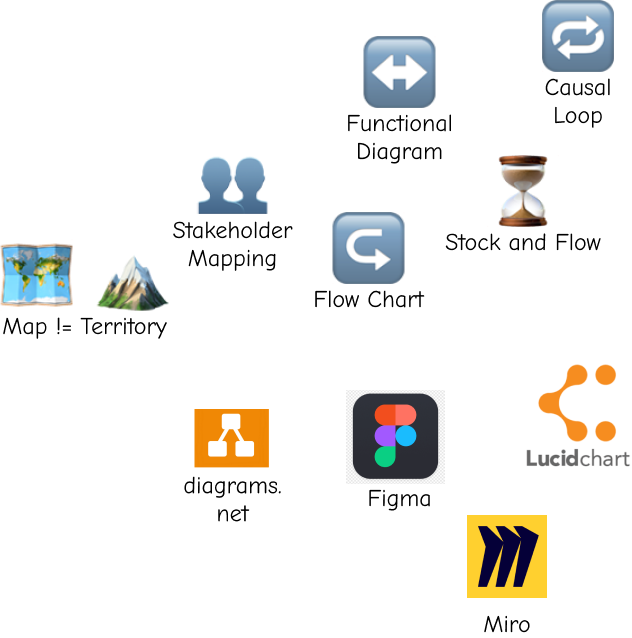
Maps can help you quickly communicate a lot of information quickly and intuitively. A picture says a thousand words, after all.
Maps are not a perfect representation of a thing. They’re an abstraction that communicates the main ideas. This can make it easier for your audience to quickly understand and remember what’s going on. It can also provide context around how your ideas fit in with the rest of the system.
Maps don’t need to be fancy, they just need to be clear. They should only include the most important things. This often includes the components of a system, as well as the relationships between them. This might look like a simple sketch, stakeholder map, flow chart, functional block diagram, causal loop diagram, stock and flow diagram, or even interactive media. Sometimes it is helpful to have different diagram/mapping tools to help you understand various aspects of your system — don’t try to fit everything onto one map! The important thing is to clearly illustrate the ideas you want to communicate.
Model

Models are like thought experiments, powered with computation. Something in between a white paper and a working implementation. This is great if you want to test an idea before building it, or want to test variations on an idea to see which might be best.
When creating a model, the point is to help you explore an idea, but also to help others do the same. As such it needs to be legible. The assumptions the model depends on as well as the things the model is specifically exploring should be made explicit. This way it’s easier to A/B test the model assumptions and parameters.
There are many tools to create models. MatLab is popular, but expensive. cadCAD is newer, and open source. There’s also stand alone frameworks like tokenSPICE that begin to incorporate EVM testnets into modeling and forthcoming cadCAD services like BlockScience Labs that make it easier to automatically run models based on real world data. What’s best for you will be dependent on the context in which you’re operating. Regardless of what tools you choose, the model should be easy to read and run. That way people can engage with and contribute to your work.
Present

Both political feasibility and incentive compatibility matter in socio-economic systems. Data is only half the battle. What action takes priority will not just depend on who can best define the goal (strategy) and the steps to get there (tactics), but also who can best communicate it and align the relevant powers around it — in other words, politics. In the context of Computer-Aided Governance this is essential. If people don’t understand what you’re talking about, they won’t be able to productively or intelligently engage with your work. Less engagement leads to lower chances of your ideas spreading and lower chances of your proposal passing. Make it easy for people to engage with your work by showing your work. List references, specify assumptions, and make your data and code accessible. A big factor in your success will just be making it easy for people to understand and engage with your proposal.
Once you have a proposal with a clear purpose and process, share your work. This implies you know who your audience is. You weren’t just writing for yourself in a vacuum were you? Of course not. You have an important message that’s both interesting and informative. You know exactly who it’s for and why they care so deeply about this topic. Your simple structured message will resonate and inspire them to action just like you were inspired to write your proposal. Right?
Right, so there’s many tools that can help you improve your writing to get there. Some are focused on mechanics and some are more for overall structure. Both are good. Start with checking your spelling, grammar, and run-on sentences. From there it helps a lot to read good writing. Good writing is subjective so this is going to be dependent on your personal preferences, and more importantly, your audience.
Debate
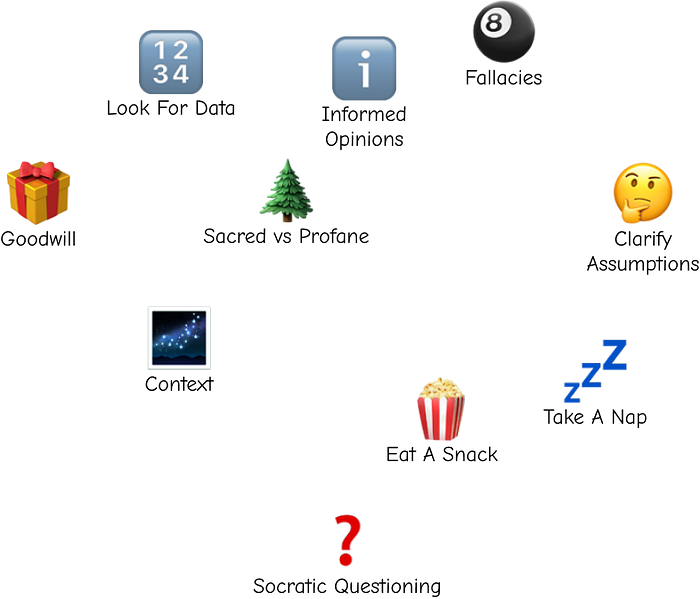
Lots of ideas sound good in theory (like this CAG MAP!). It’s not until you test them out that you know whether they will work or not. Sharing your ideas and getting real world feedback can even help to make your ideas better.
Good feedback requires critical thinking, and critical thinking implies that people will be critical. Hopefully this energy will be directed towards your ideas, but it might just be directed at you. If you can graciously internalize the former and ignore the latter your life will be great. If not, you’ll build a lot of character or die trying.
The arena in which these critiques are delivered is called politics. In an enlightened society, this is how we debate ideas and adjudicate between the preferences of stakeholders. In most societies it’s how we battle for power. This isn’t because people are evil, it’s because we’re people. It’s what we do. Arming yourself with objective data, inter-subjective social agreements, and a proposal that speaks to the interests of your stakeholder group as well as the system at large (aka other stakeholders) is a great start. Then you have something feasible that might be worth fighting for.
Enact
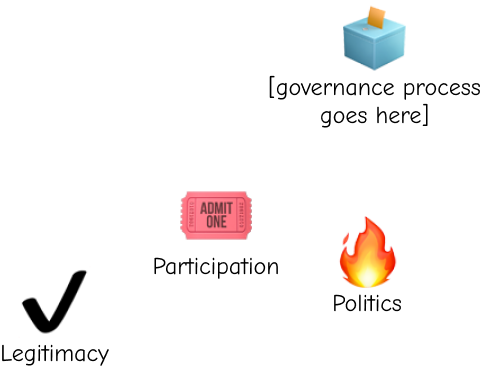
Decisions!
Actions are required to create change. Once an idea has been debated and refined it needs to be enacted. Ideally this process is viewed as legitimate by the stakeholders of the system. If so, then engage in that process to voice your preferences. If the process is not viewed as legitimate, then find a new system to engage with because without a legitimate governance process you’re living in a world of pure power where the 800 lb gorilla rules.
The specific mechanisms used to make decisions in any specific system are going to be unique. It’s very important that you understand how they work so that you can engage with them productively. You’re on your own to figure that out.
Also, be aware that just because a decision is made does not mean it will create the outcomes you want. You probably have a theory about what could, should, or will happen — but it’s not until you test it out that you’ll know. And even then it’s often unclear! For non-deterministic decisions with execution risk it can be hard to tell if success or failure was caused by the execution of the decision or the decision itself.
Monitor
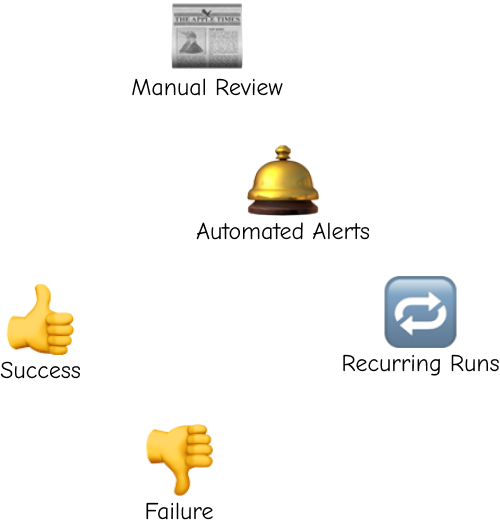
Science wouldn’t work if we ran experiments but didn’t bother to record the results. The same goes for governance. There needs to be a feedback loop between decisions and results. Monitoring allows you to verify the results of decisions to see if they had their intended effects.
If a proposal succeeds you’ll want to see if it actually has the effect you intended. If so, then great. If not, then figure out why.
If a proposal doesn’t succeed, that’s OK too. If you had a hypothesis of what will happen if your proposal does not pass then you can validate that. This can provide data to support your original proposal, potentially allowing you to resubmit a modified version with more evidence (“I told you so!”).
Monitoring complex systems is a lot of work, but there’s tools that can help. You’ll probably want to automate things like feeding raw data into recurring model runs and alerts based on key metrics — and you’ll probably want to manually read community discussions to understand context and sentiment. Analysis of both objective data and subjective social activity are important to understand the global view of a system. One without the other is likely to lead to a local, rather than global optimum.
TL;DR:
The CAG MAP is a data-driven political process. The goal is to help stakeholders understand, improve, and maintain the systems they care about.
In a pluralistic society there is no such thing as the indisputable public good. It’s up to stakeholders to advocate for their own interests. If interests are aligned things might work out, but if they are not then your road may be very difficult indeed. Always seek to align interests.
Creating proposals that align interests requires critical thinking. Critical thinking requires being critical. The CAG MAP can help you use a data-driven process to write, analyze, and critique proposals. This isn’t guaranteed to be great, but it is guaranteed to be better than just arguing with each other, in the absence of good data.
Good luck out there, participatory governance systems can be challenging!
The next article in this series can be found here: Computer-Aided Governance in Action: Steering Complex Systems Using the CAG Map
About BlockScience
BlockScience® is a complex systems engineering, R&D, and analytics firm. Our goal is to combine academic-grade research with advanced mathematical and computational engineering to design safe and resilient socio-technical systems. We provide engineering, design, and analytics services to a wide range of clients, including for-profit, non-profit, academic, and government organizations, and contribute to open-source research and software development.

