
Case Studies of Data-Driven Decision Making in Cybernetic Organizations
This piece is a continuation on the topic of Computer-Aided Governance (CAG), a computational decision-support framework under development at BlockScience. Part 1 explored the concept of Computer-Aided Governance (CAG), while part 2 unpacked the concept into the CAG Map and Process (MAP).
This article will analyze and apply the CAG MAP — an exploratory tool to help communities use computational aids to better understand and steer complex systems — to a subset of BlockScience collaborations, in order to demonstrate computer-aided governance in action for participatory decision-making.
Recap: The Meaning & Mapping of Computer-Aided Governance
In a previous article, we explored the concept of Computer-Aided Governance. Since then, we have expanded its definition to generalize the framework for wider use:
Computer-Aided Governance is:
A decision-support process that leverages technology to evaluate the potential results of policies and interventions, leading to more inclusive and informed decision-making.
The application of open (data) science methodology for algorithmic policy design and/or decision analysis in self-governing communities.
A practice of empirically informed governance, including scientific deliberation.
Ultimately, we are interested in Computer-Aided Governance because of its ability to minimize the tradeoffs that exist between inclusive and informed decision-making. In general, the smaller the group of decision-makers in a given community, the easier it is to keep everyone informed on relevant issues to that community, so that they can make decisions accordingly. The larger that decision-making group grows (i.e. the more inclusive it is), the ratio of well-informed participants decreases overall ( e.g. due to information asymmetries, expertise silos, etc), often to the detriment of the decisions being made. Computer-Aided Governance, when applied correctly, could be a useful tool to maintain both an inclusive and informed group of decision-makers, which is a key challenge in many Decentralized Autonomous Organizations (DAOs) and distributed organizations today.
Although CAG could certainly be expanded beyond decentralized ledger technologies (DLT)blockchain technologies and the cadCAD modeling tool to any data-driven and evidence-based policy-making system, for our audience this seems like a reasonable place to begin, given the novelty of these technologies, the high-fidelity data streams they offer and our experience applying the CAG map in this context.
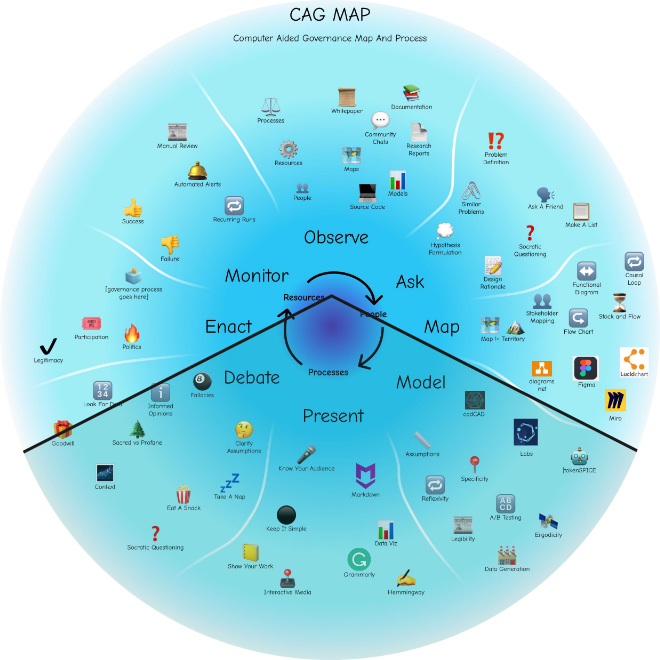
In our second piece on the topic, we outlined the Computer-Aided Governance Map and Process (CAG MAP), which can be seen below:
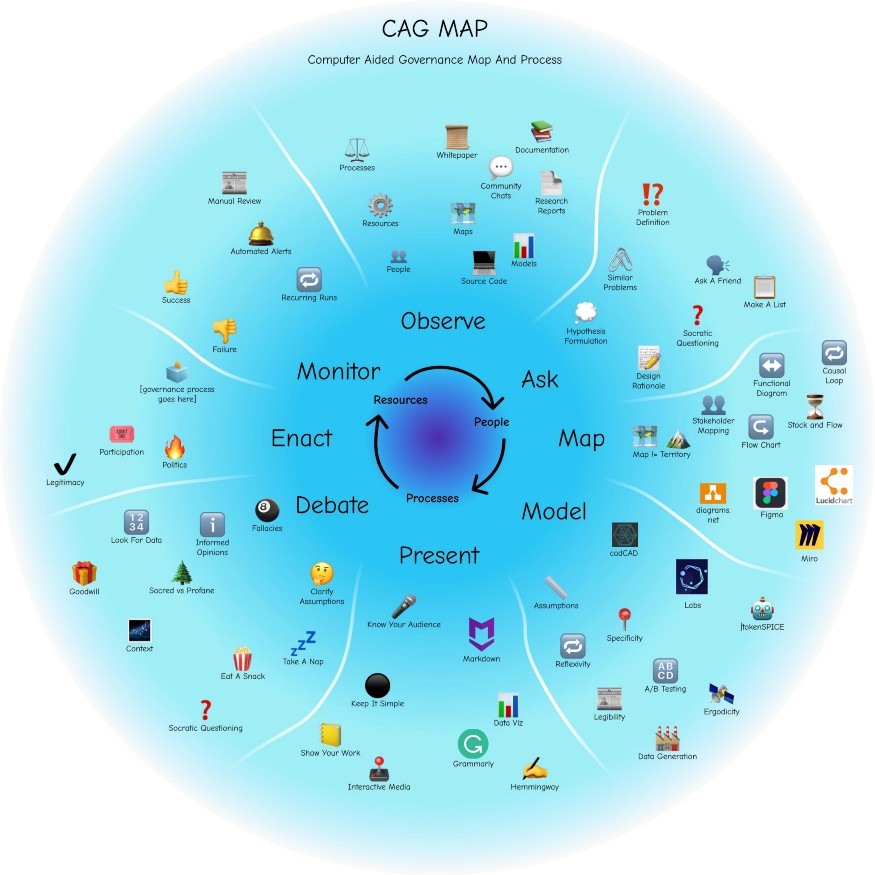
The governance of community processes is a continuous process and therefore, use of the CAG map should be iterative. The CAG process can be broken down into eight recursive steps for participatory decision-making:
1. Observe: the system in its natural state, its stocks & flows
2. Ask: who, what/what if, when, where, why?
3. Map: draw a picture representing interconnections
4. Model: thought experiments, with code!
5. Present: share your ideas with your community
6. Debate: collectively applied critical thinking
7. Enact: make a decision and take action
8. Monitor: log results for learning
With the repetition of this process, new realizations lead to new questions, proposals, etc. as mentioned above, therefore iterating on this process may occur indefinitely as the organization adapts its system to fulfill its purpose, or individual actors in the system aim to maximize their own incentives.
“There is massive potential in the use of computer-aided design tools in building cryptoeconomic networks and Computer-Aided Governance. It introduces a critical engineering iteration loop that is lacking in the blockchain [Web3] space today… With Computer-Aided Governance, we are exploring systems of estimated dynamic behavioral feedback and simulation that could massively improve our decision-making abilities as stewards of our complex social systems. “ (Zargham & Emmett 2019)
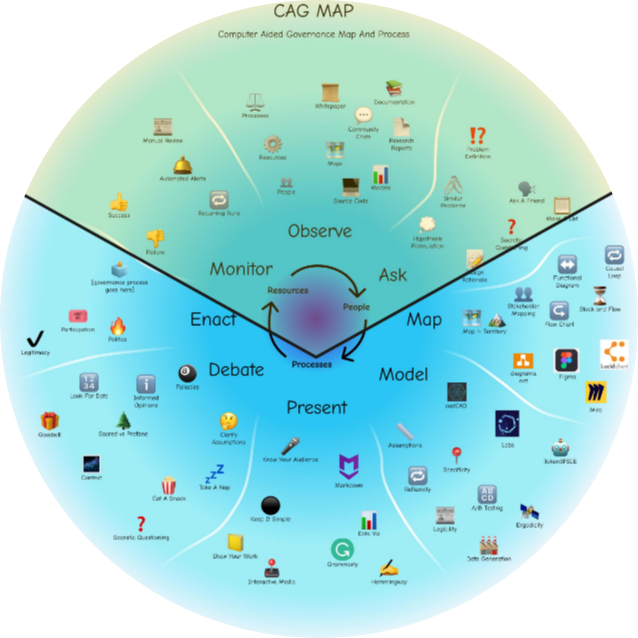
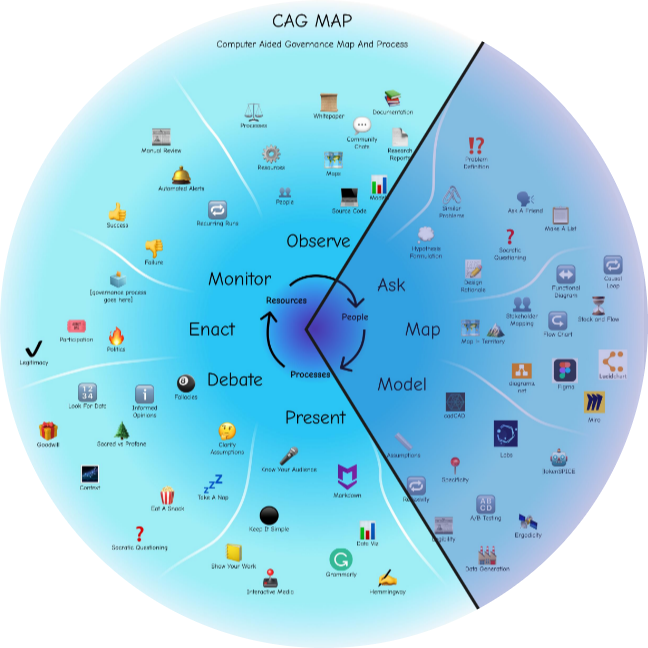
Breaking the CAG MAP into Quadrants
Further understanding of the CAG Map can be facilitated by breaking it up into four quadrants, each dealing with a specific phase of community decision-making. The rest of this article will apply the CAG MAP quadrants to various BlockScience collaborations that make use of the processes defined above. Below, we break the MAP up into four quadrants and analyze each in turn:
- Information Gathering (Monitor — Observe — Ask): The basis of system design requires that we monitor, observe, and ask questions of systems to fully understand their context, before attempting to change them. The nature of complex systems often include non-linearities, causing simple actions to have unintuitive effects on larger system goals.
- Hypothesis Building (Ask — Map — Model): Once we have inquired enough to develop an intuition for the ‘shape’ of the system under analysis, the next step is to accurately map out its components, stakeholders, and the flows between them, and then represent that system in a model (cadCAD or otherwise), where we can build and test hypotheses.
- Peer Review & Lobbying (Model — Present — Debate): The model of a system can now be used to run data-driven experiments on proposed changes or behaviors of the system in question, which provide a more evidence-based foundation from which to discuss and debate those changes (and their alternatives) with a larger community of participating decision makers (who may not be experienced in data science).
- Experimentation & Outcomes (Debate — Enact — Monitor): Finally, once proposed changes are officially decided upon, they are ready to be enacted and monitored for short- and long-term impacts on the system. This brings us back to the beginning of the Computer-Aided Governance process, which can be started again for the next iteration of your system!
Next, we will apply these CAG MAP quadrants to four different BlockScience collaborations, to give you a feel for how these concepts map to real-world projects.
Applying the CAG MAP to BlockScience Collaborations
BlockScience is focused on pioneering social and technical research and working with values-aligned teams to develop, apply, and improve our insights in the management and steering of complex systems.
To illustrate field applications of the CAG Map, we selected a diverse set of examples from some of our most innovative research and development collaborations in socio-technical systems and economic engineering initiatives. We begin with the first quadrant:
1. Information Gathering: Ethnographic Research with Lido DAO
The first quadrant of the CAG MAP relates to information gathering via Monitoring, Observing, and Asking. Governance researchers from BlockScience use quantitative and qualitative research to monitor potential vulnerabilities in a system, observe governance processes, and ask questions to engage in critical analysis of a system.
An example of applying these principles can be seen in BlockScience’s ‘vulnerability mapping’ analysis with LidoDAO. The goal was to understand the social, technical, and economic dynamics as well as the endogenous and exogenous threats to the DAO, including vulnerabilities in the governance surface. This research employed ethnographic methods to do so.
The BlockScience team reviewed documentation, code, and the community’s communication channels, performed mapping and interviews of the stakeholders, ecosystem, and technical layers, and examined vulnerabilities of the Lido system. Among other questions, they asked, “what are potential threats, and are there areas of governance that need to be minimized in order for the organization to fulfill its purpose while giving the greatest autonomy to operators?”. The outcome — a report in the form of a blog resulted in not only improved monitoring and suggestions for improvements and further, recurring analyses, but key general learnings for governance practitioners across DAOs with insights on common vulnerabilities, governance “right-sizing” and some suggestions for threat mitigation.
This is one example of a collaboration that relates to the Monitor-Observe-Ask quadrant of the CAG MAP, which helps decision-makers to locate themselves in their current system’s situation and context, such that they can move towards hypothesis building and experimentation. Next, we’ll move on to the Ask-Map-Model quadrant to learn how to represent our observations in accurate maps and models of the system in question.
2. Hypothesis Building: GitcoinDAO Sybil Detection Mapping
Moving to the next quadrant of the CAG MAP, we take a look at the work BlockScience has done in collaboration with GitcoinDAO, and the Fraud Detection & Defense (FDD) working group in particular. Past work with GitcoinDAO involved asking questions in discussion with the Gitcoin community in order to map established stakeholders, value flows & goals of the GitcoinDAO Fraud Detection & Defense working group, and then model an appropriate sybil detection pipeline to address malicious behavior attempting to take advantage of Quadratic Funding.
Some of the publications released in this collaboration involved analyzing the network of Gitcoin Grants and asking whether patterns seen there were true instances of malicious collusion, as well as mapping the Sybil Detection process and operationalizing it to deter adversarial behavior at scale. There was also an #OpenScience collaboration series with the Token Engineering Academy that encouraged data scientists and modelers to participate in the converging data science processes of sybil detection, which saw teams of collaborators learning, working & presenting together to address common challenges in GitcoinDAO’s sybil detection ecosystem.
Now that we’ve covered the Ask-Map-Model quadrant, we have a better understanding of how we can determine the structure of the system under design, and how we might model that representation for more data-driven analysis. This brings us to the next quadrant of the CAG MAP, Model-Present-Debate, which is where we start to use the results from our models to discuss beneficial protocol updates with the larger community.
3. Peer Review & Lobbying: 1Hive DAO $HNY issuance
BlockScience’s work with 1Hive began with the initialization of Luna Swarm, a working group with the aim of modeling the dynamic issuance policy for their native token, $HNY, which would then be presented to the 1Hive community and debated on its merits before being deployed. Honey is the incentive token created by the 1Hive DAO to reward contributors for their work, and is issued to proposals that receive sufficient support via a Conviction Voting system.
This process involved modeling the 1Hive ecosystem and the multiple parameters involved, and then running simulations of various issuance scenarios and collating results into a dynamic issuance proposal that was presented to the 1Hive community. The proposal was subsequently voted into deployment. Laudably, developers in the 1Hive community maintained and updated the model over the course of a full year, and even recommended parameter updates to the dynamic issuance policy as well as other parameters in the 1Hive ecosystem based on observed system performance, which were voted on to adjust parameters according to the needs of the 1Hive ecosystem. 1Hive sets a wonderful example of Computer-Aided Governance emerging naturally in digital communities!
After a community completes the Model-Present-Debate quadrant of the CAG MAP (provided they do it well, of course), we can reasonably expect that platform users or DAO members will be more informed and included in key decision-making processes in the community. Finally, we come to the last quadrant of the CAG MAP, where we Debate-Enact-Monitor the changes under discussion and ensure they meet system needs.
4. Experimentation & Outcomes: RAI stablecoin stability
In the final quadrant of the CAG MAP, we take a look at the work carried out with Reflexer Labs on the RAI stablecoin, which focused on debating the configuration of relevant parameters, enacting specified configurations after appropriate due diligence and monitoring the impacts of those choices over a range of system metrics to ensure the right choices were made.
The design process of the RAI stablecoin involved deep dives into PID controllers and other control theoretic concepts, in particular how to configure them for a stablecoin such as RAI. This involved a deeper education process into optimizing complex systems and how to perform parameter selection under uncertainty. The chosen configuration was enacted and key metrics are continuously monitored by any participant in the RAI ecosystem via a real-time stats dashboard. For those interested in more details about the RAI digital twin, another #OpenScience initiative with the Token Engineering Academy was carried out and is recorded as a Youtube playlist.
Repeat & Iterate
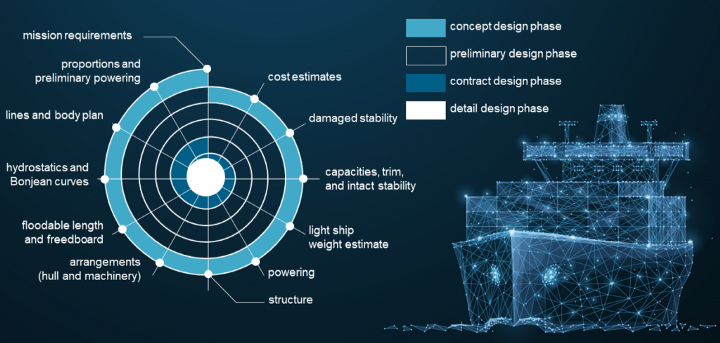
Finishing with the final quadrant of the CAG MAP, we now loop back to the beginning of the process and can prepare for another pass around the MAP to further iterate some other aspects of our system! The recursive component to this process is vitally important, since complex systems are alive and adaptive, which means they are constantly changing. As we often pull from existing engineering disciplines, the diagram below from Naval Engineering provides a helpful visualization for how we can progress through the stages of the CAG MAP, continually iterating towards improved system operation.
Ultimately, we are interested in Computer-Aided Governance because of its ability to minimize the tradeoffs that exist between inclusive and informed decision-making.
Closing Out
Participatory decision-making in systems with diverse groups of stakeholders requires a political process of compromise. Data can be interpreted differently, but there needs to be a source of data that all can agree on. Assumptions, held as inter-subjective reality, need to be explicitly stated so stakeholders can agree on strategy (mission/vision) even if they disagree on tactics (concrete steps to get there). Informed participatory governance uses models and data as sensemaking tools to integrate with discourse, not just rhetoric.
Computer-Aided Governance allows us to employ data, simulation, and modeling to explore tradeoffs between various choices — with respect to system goals — to form the basis of this discourse. The CAG Map and its quadrants support CAG as a process of gathering information, building hypotheses, providing opportunities for peer review and lobbying, experimentation, and examining outcomes. This must also be viewed as a process that needs repetition and iteration, to adapt to changing circumstances while maintaining alignment with the system or community’s purpose or goal.
There are many other projects involving BlockScience and our many partner organizations that could have been analyzed with this framing, but we hope this further digestion of the CAG MAP in relation to a few ongoing projects was helpful to give further context toward applying the nascent Computer-Aided Governance map and process.
We hope this open framework for the analysis and design of complex systems is helpful to you and your community. Keep in mind that this framework can be used as rigorously as needed for decision-making in your community — we particularly recommend taking the time to carefully analyze decisions that either impact a large number of people, or those that are not easily changeable in the future. If you’re interested in exploring the CAG MAP further for your community’s use case, please get in touch!
To learn more about Computer-Aided Governance, check out our playlist of related talks and presentations here.
This article was written by Jeff Emmett with contributions from Jessica Zartler and Kelsie Nabben, from research by Michael Zargham and Burrrata.
